
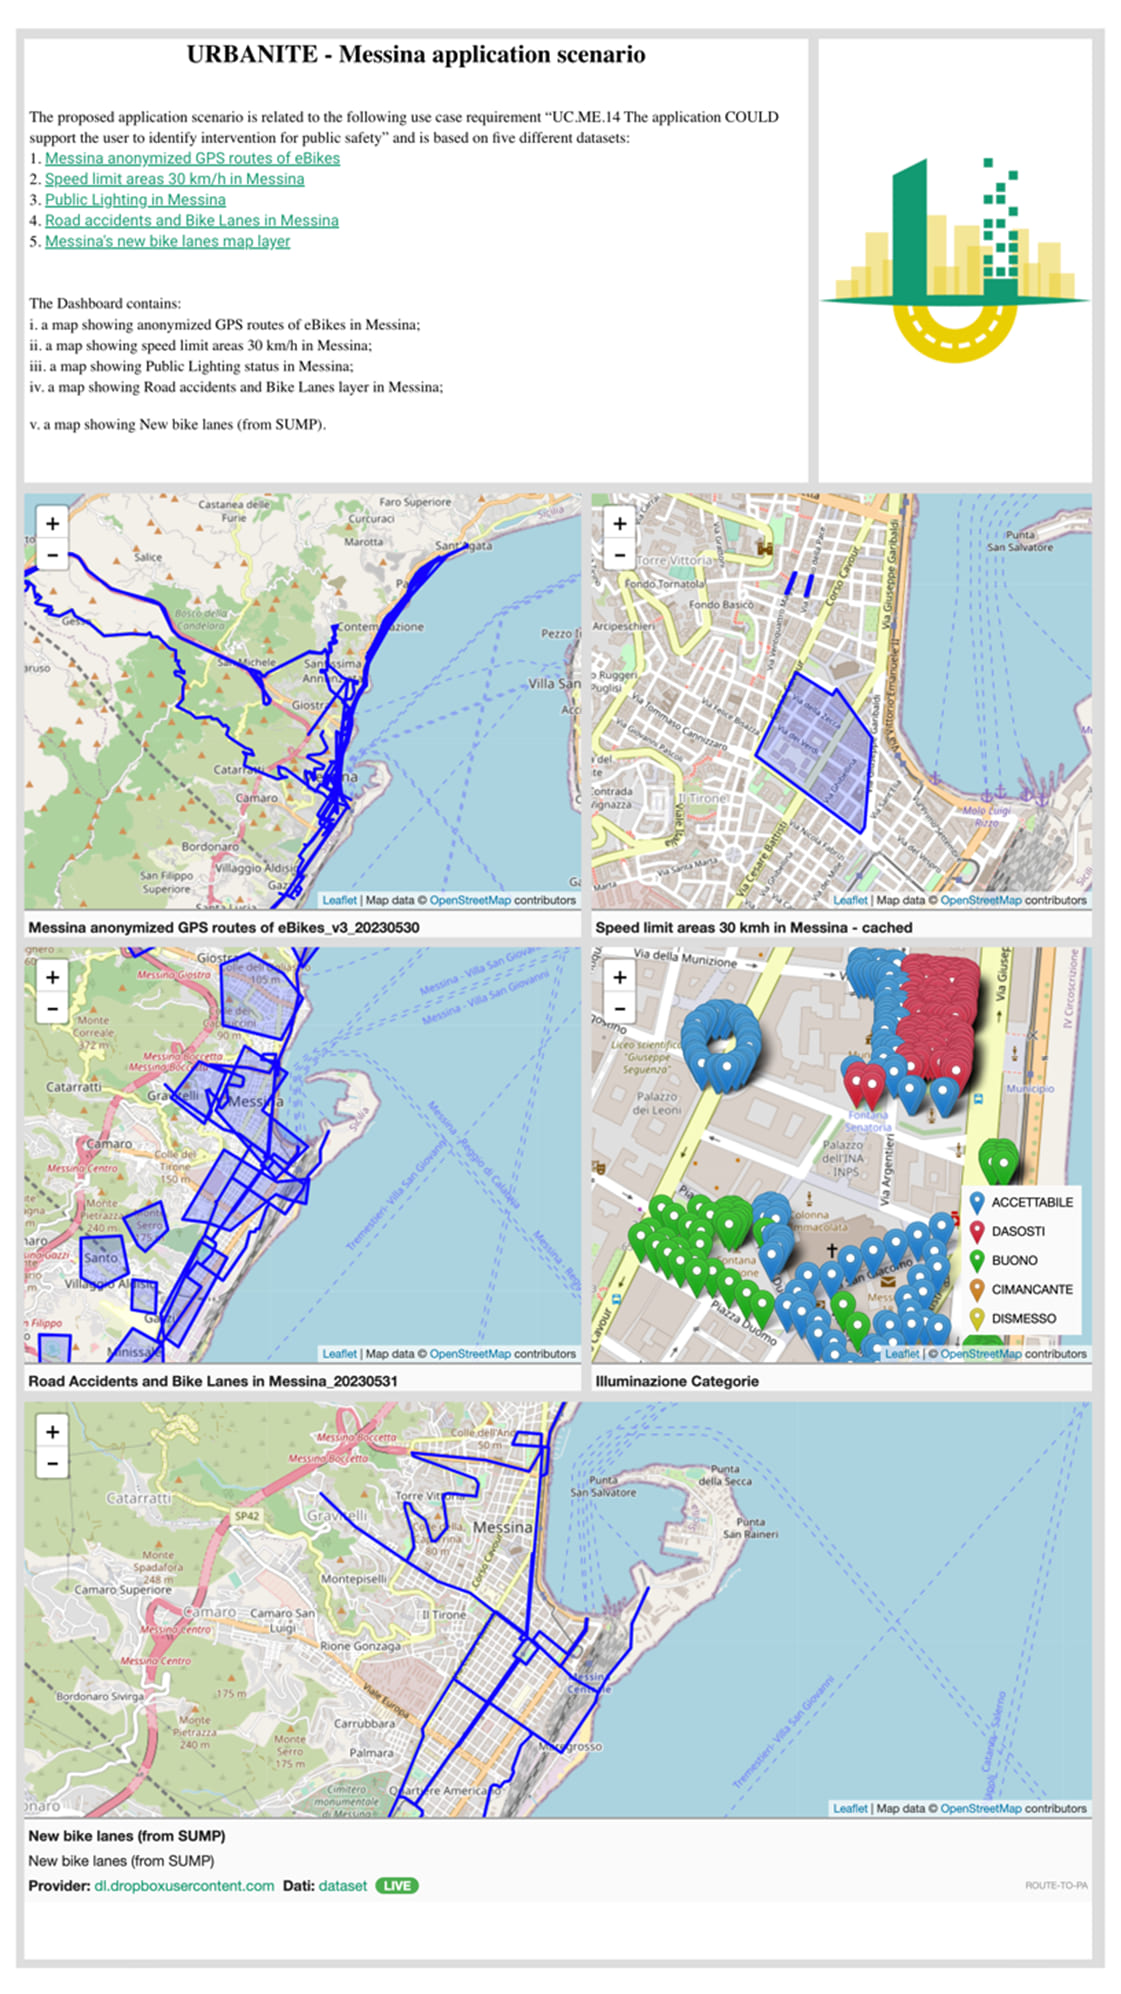
Custom dashboards – A practical example
Among its functionalities, The URBANITE Platform allows its users to build and share custom dashboard.
The users can easily create, edit, clone, access available dashboards, as well as share (with other users of the platform) and make publicly accessible a dashboard, facilitating the overcome of information silos and driving decision-makers from information share to knowledge share.
The underlying rationale of a custom dashboard is to implement a data driven process to represent knowledge concerning a wide range of potential topics (e.g. make aware of a problem, explain the rationale of a policy, etc.).
Here, a storytelling of interaction among three fictional users of the Messina use case through the custom dashboards is briefly reported.
These are:
Mobility Manager: an employee of the Municipality who is in charge of monitoring and planning the viability (e.g. monitor traffic, identify possible solutions to traffic congestions, etc.), aiming to understand which safety management activities could be potentially carried out in order to reduce the likely traffic accidents (e.g. poorly lighted areas, speed limit areas, etc.).
Data Analyst: an employee of the Municipality with technical competences in data analysis and data visualization, aiming to build and share dashboards to perform data analysis and data visualization-related activities.
Facilities and Roads Maintenance Manager: an employee of the Municipality who is in charge to monitor and execute renovation actions for public facilities and public roads maintenance, aiming to execute renovation actions for public bike lanes and public lighting maintenance in order to reduce the likely traffic accidents.
Storytelling
- Mobility Manager checks availability of analysis related to bike safety of roads and the new programmed bike lanes.
- Since the analysis is not yet available, Mobility Manager contacts Data Analyst to design a dedicated dashboard that takes into account road incidents and status of public lightning.
- Data Analyst identifies the needed datasets within the URBANITE Data Catalogue and builds the dashboard.
- Data Analyst shares the dashboard with the Mobility Manager.
- Mobility Manager accesses the dashboard shared by Data Analyst and analyses the provided data visualisations.
- Mobility Manager finds that it would be useful to have on the same map city areas more affected by road incidents and the new programmed bike lanes.
- Mobility Manager contacts Data Analyst asking for the needed update of the dashboard.
- Data Analyst produces a new dataset (map layer) that combines city areas more affected by road incidents and the new programmed bike lanes.
- Data Analyst uploads the new dataset on the URBANITE Platform and updates the dashboard.
- Mobility Manager accesses the updated dashboard.
- Mobility Manager finds that the dashboard could offer a valid support to Facilities and Roads Maintenance Manager to prioritise maintenance interventions on public lightning where new programmed bike lanes are expected, and road incidents are located.
- Mobility Manager informs Facilities and Roads Maintenance Manager about his findings and shares the dashboard with him/her.
- Facilities and Roads Maintenance Manager access the dashboard and analyses the provided data visualisation.
Authors: Giuseppe Ciulla and Franceso Pillitteri